Hypometric genetics: Improved power in genetic discovery by incorporating quality control flags
Tanigawa and Kellis. Am J Hum Genet. (2024).
Phenotype: Free Chol. to Tot. Lipids in CMs and XXL VLDL % (BLQ removed)
- Estimated h2 in white British population in UKB: 0.055 (95% CI:[0.043, 0.066]).
Free Chol. to Tot. Lipids in CMs and XXL VLDL % (BLQ removed) iPGS coefficients
Our FAQ page shows the description of the file format and how you may use iPGS coefficients in your research.
Predictive performance of iPGS models
We evaluated the predictive performance of the inclusive polygenic score models using the held-out test set individuals.
Population |
Model |
PGS trait type |
Metric |
Predictive Performance |
95% CI |
P-value |
|---|---|---|---|---|---|---|
| Population | Model | PGS trait type | Metric | Predictive Performance | 95% CI | P-value |
|
|
||||||
| white British | Covariate-only model | Derived (percentage traits, excl. BLQ measurements) | R2 | 0.044 | [0.040, 0.048] | 8.0x10-286 |
| white British | Genotype-only model | BLQ (derived) | R2 | 0.007 | [0.005, 0.008] | 2.8x10-44 |
| white British | Genotype-only model | Derived (percentage traits, incl. BLQ measurements) | R2 | 0.041 | [0.037, 0.044] | 1.3x10-264 |
| white British | Genotype-only model | Derived (percentage traits, excl. BLQ measurements) | R2 | 0.045 | [0.041, 0.049] | 4.7x10-296 |
| white British | Full model (covariates and genotypes) | BLQ (derived) | R2 | 0.011 | [0.009, 0.013] | 1.9x10-69 |
| white British | Full model (covariates and genotypes) | Derived (percentage traits, incl. BLQ measurements) | R2 | 0.082 | [0.077, 0.087] | <1.0x10-300 |
| white British | Full model (covariates and genotypes) | Derived (percentage traits, excl. BLQ measurements) | R2 | 0.091 | [0.086, 0.096] | <1.0x10-300 |
| Non-British white | Covariate-only model | Derived (percentage traits, excl. BLQ measurements) | R2 | 0.034 | [0.016, 0.052] | 5.8x10⁻¹⁰ |
| Non-British white | Genotype-only model | BLQ (derived) | R2 | 0.000 | [-0.002, 0.002] | 5.0x10-01 |
| Non-British white | Genotype-only model | Derived (percentage traits, incl. BLQ measurements) | R2 | 0.016 | [0.003, 0.028] | 2.9x10-05 |
The predictive performance (R2), its 95% confidence interval (CI), and statistical significance (P-value) are shown for each population in UK Biobank in the held-out test set. The "model" column indicates whether the predictive performance is from the covariate-terms alone (covariate-only model), PGS terms alone (Genotype-only model), or the full model containing both PGS and covariate terms. We used the following sets of covariates in our analysis: age, sex, age2, age*sex, Townsend deprivation index, and genotype PCs (PC1-PC18). Please refer to our publication for a more detailed description of the methods.
Coefficients (BETA) of PGS models
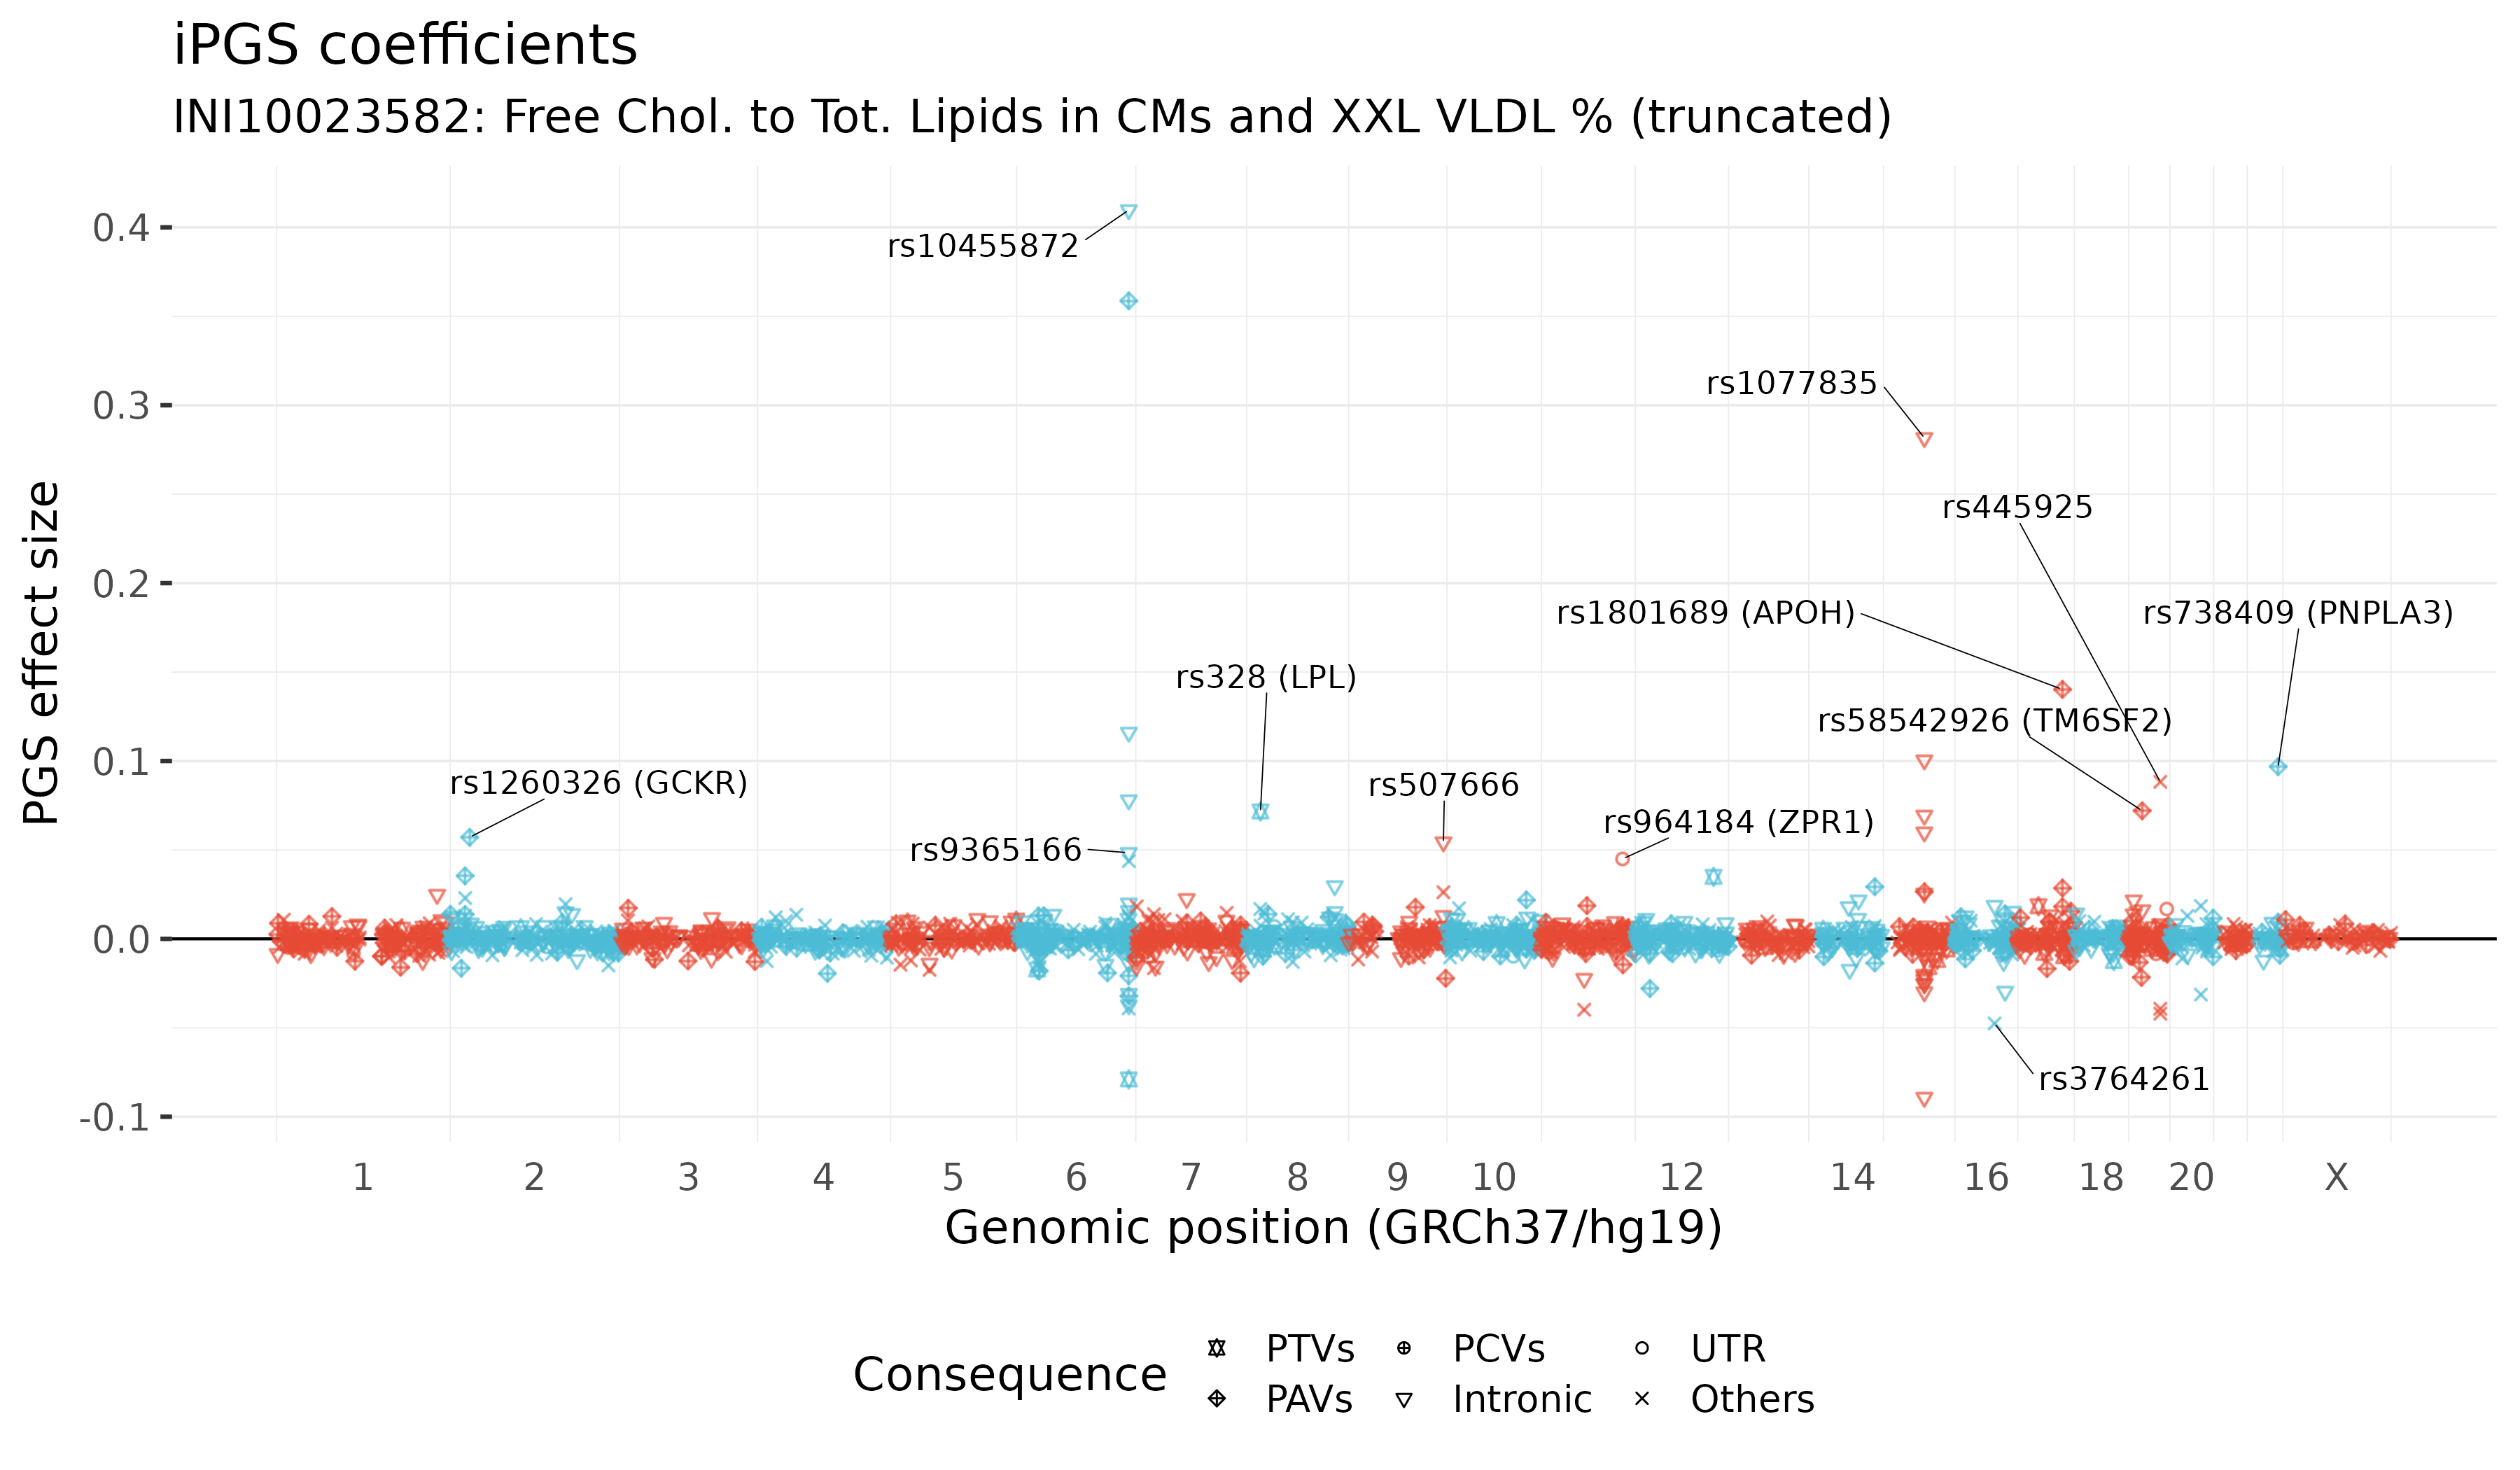
We show the coefficients (BETA) of PGS models. Our iPGS model selected 2707 variants with non-zero coefficients. The genetic variants with the large absolute values of coefficients are annotated in the plot. There is no guarantee that our iPGS model selects causal variants. We use the GRCh37/hg19 reference genome.
The top 100 genetic variants with the largest absolute value of coefficients
CHROM |
POS |
Variant |
Variant ID |
Effect Allele |
Consequence |
Gene symbol |
Effect Weight |
|---|---|---|---|---|---|---|---|
| CHROM | POS | Variant | Variant ID | Effect Allele | Consequence | Gene symbol | Effect Weight |
|
|
|||||||
| 6 | 161010118 | 6:161010118:A:G | rs10455872 | G | Intronic | LPA | 0.409741482729792 |
| 6 | 160961137 | 6:160961137:T:C | rs3798220 | C | PAVs | LPA | 0.35870409697424 |
| 15 | 58723426 | 15:58723426:A:G | rs1077835 | G | Intronic | ALDH1A2, LIPC | 0.281662226606316 |
| 17 | 64210580 | 17:64210580:A:C | rs1801689 | C | PAVs | APOH | 0.140200025806681 |
| 6 | 161017363 | 6:161017363:G:A | rs73596816 | A | Intronic | LPA | 0.115988430770696 |
| 15 | 58678512 | 15:58678512:C:T | rs10468017 | T | Intronic | ALDH1A2 | 0.100413643481753 |
| 22 | 44324727 | 22:44324727:C:G | rs738409 | G | PAVs | PNPLA3 | 0.0967988417631485 |
| 15 | 58683366 | 15:58683366:A:G | rs1532085 | G | Intronic | ALDH1A2 | -0.0892635539508071 |
| 19 | 45415640 | 19:45415640:G:A | rs445925 | A | Others | APOC1 | 0.0882698677617636 |
| 6 | 161006077 | 6:161006077:C:T | rs41272114 | T | PTVs | LPA | -0.079015983366555 |
There is no guarantee that our iPGS model selects causal variants. We show the top 100 variants with the largest effect size (BETA). To see 2707 variants included in our iPGS model, please download the iPGS coefficients by clicking the download button. We use the GRCh37/hg19 reference genome.
Follow-up analysis
There are several ways to use the resource in your research. First, you may use our iPGS coefficients and compute individual-level polygenic scores for your cohort. Second, you may also investigate the genetic variants with non-zero coefficients and their annotated genes to learn more about biology by taking advantage of the sparsity of our iPGS models. For your convenience, here we suggest several resources as an example of follow-up analysis. We do not intend to cover all the relevant follow-up analyses.
Using iPGS coefficients
By clicking the download button above, you may download the iPGS coefficients. Our FAQ page shows the description of file format and how you may use iPGS coefficients in your research.
HaploReg is a tool for exploring annotations of the non-coding genome at variants on haplotype blocks. The button above submits the top 100 genetic variants with the largest absolute value of coefficients as a query to HaploReg using the default parameters in HaploReg v4.2 (LD threshold r2 >= 1, ChromHMM 15-state model, SiPhy-omega, and GENCODE genes). HaploReg's ability to browse haplotypes is useful here as there is no guarantee that our iPGS model selects causal variants. The 'top 100 variant' cutoff is an arbitrary threshold; we aim to demonstrate how one may investigate the selected variants. Please check Ward and Kellis. Nucleic Acids Res. 2012 and Ward and Kellis. Nucleic Acids Res. 2016 for more information on HaploReg.
References
-
Y. Tanigawa and M. Kellis. Hypometric genetics: improved power in genetic discovery by incorporating quality control flags. Am J Hum Genet. (2024).
- We introduce an application of the inclusive PGS approach to hypometric genetics (hMG) study.
- Supplementary Data Files at the Open Science Framerowk (doi: 10.17605/OSF.IO/CEB7G)
-
Y. Tanigawa and M. Kellis. Power of inclusion: Enhancing polygenic prediction with admixed individuals. Am J Hum Genet. (2024).
- We introduce our inclusive PGS approach in this publication.
- Supplementary Data Files at figshare (doi: 10.6084/m9.figshare.22905368)
- MIT News article: Making genetic prediction models more inclusive
- Author interview: Inside AJHG: A Chat with Yosuke Tanigawa
-
J. Qian, Y. Tanigawa, W. Du, M. Aguirre, C. Chang, R. Tibshirani, M. A. Rivas, T. Hastie. A fast and scalable framework for large-scale and ultrahigh-dimensional sparse regression with application to the UK Biobank. PLoS Genet. 16, e1009141 (2020).
- In iPGS, we fit penalized multivariate regression on individual-level data using the BASIL algorithm implemented in the R snpnet package. This publication describes the BASIL algorithm and the R snpnet package.